
No one likes it when an app crashes. And that’s putting it mildly. Crashes fray the nerves of users and developers alike. Errors in code degrade the user experience and, as a result, affect conversions. Crash analytics are essential for every product team, and the new crash reports from AppMetrica, an all-in-one analytics and marketing platform for app creators and developers worldwide, will help you keep a finger on your app’s pulse and speed up troubleshooting.
(PRESS RELEASE) MOSCOW, 15-Oct-2019 — /EuropaWire/ — After the large-scale changes, crashes are now decoded automatically, and the interface allows developers and QA engineers to access much more useful information in just a couple of clicks.
How crash reports work
The AppMetrica crash reports show the number of crashes, sort them by type and frequency, and provide detailed statistics for each crash. The completely redesigned interface boasts a bunch of extra features. New mechanisms have been added for delivering crash data from devices and automatically loading information that’s important for identifying and fixing errors.
Crash data collection process is divided into three stages, each of which has a component in AppMetrica:
- An app crashes, AppMetrica SDK gets a log from the operating system.
If an app suddenly closes, the OS generates a crash log file with a stack trace, sends it to AppMetrica SDK which then sends it to the server.
- The crash log is saved and processed on the server.
AppMetrica’s backend receives crash data from the SDK and automatically decodes the stack trace. The crash log is then saved in a readable form in the database. All crashes are grouped by type and location, with data matched to the rest of the information collected by AppMetrica. Metrics are calculated for the number of affected devices and sessions, % of the active audience affected, and other important aspects.
- The developer receives reports in the interface.
To make the data easier to interpret, AppMetrica groups crashes, categorizes the information, and builds useful data slices and cross-sections.
How the new reports help dealing with crashes
The updated interface allows users to monitor app stability on a daily basis. Problems can be investigated on three levels:
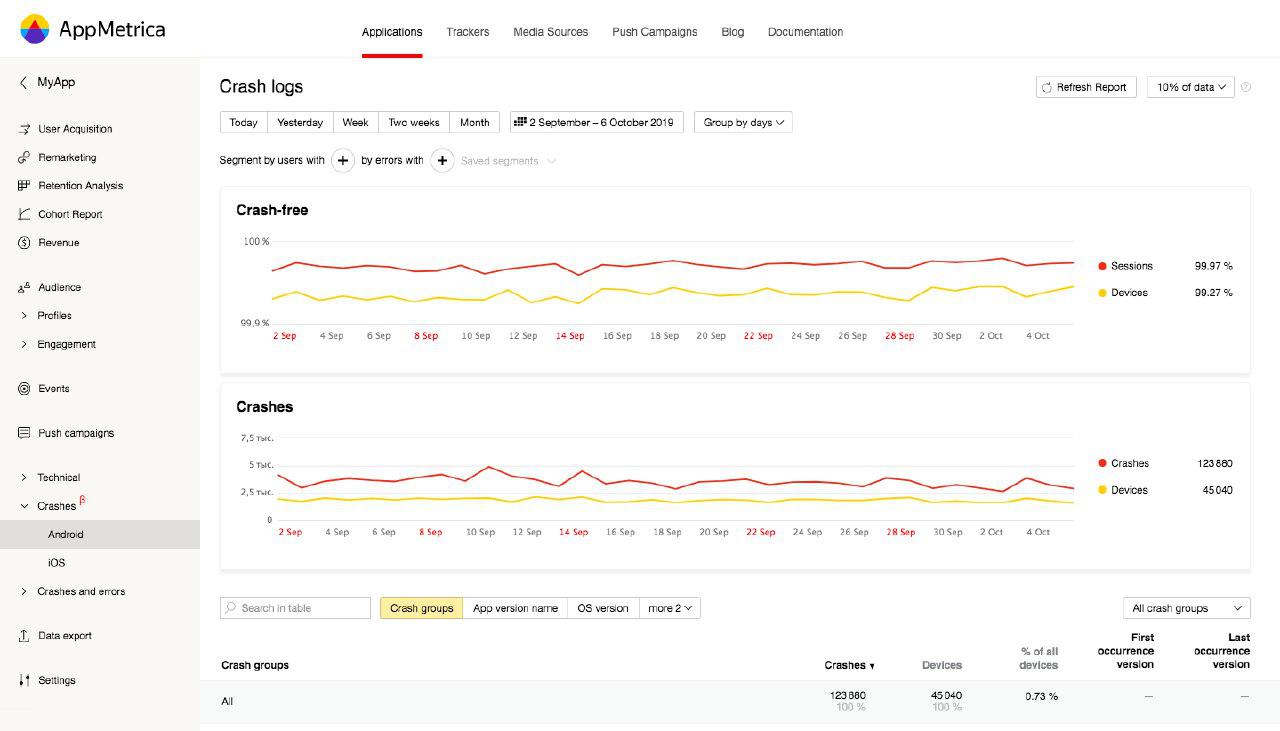
Top level on the app health dashboard
Dashboards with crash-free statistics, percentage of affected users, and other metrics help prioritize crashes in the queue, with familiar stats, like total number of crashes and number of affected devices, still present as well.
The table under the chart also includes the information such as first occurrence version, showing which app version first experience the crash, and last occurrence version, which can be used to see if the problem has been fixed.
Users can still filter and group crashes by app version, OS, and other segments, similar to the Audience report. Fixed crashes can be closed, just like in a task tracker. If a closed crash reoccurs in a new version, it will be reopened automatically.
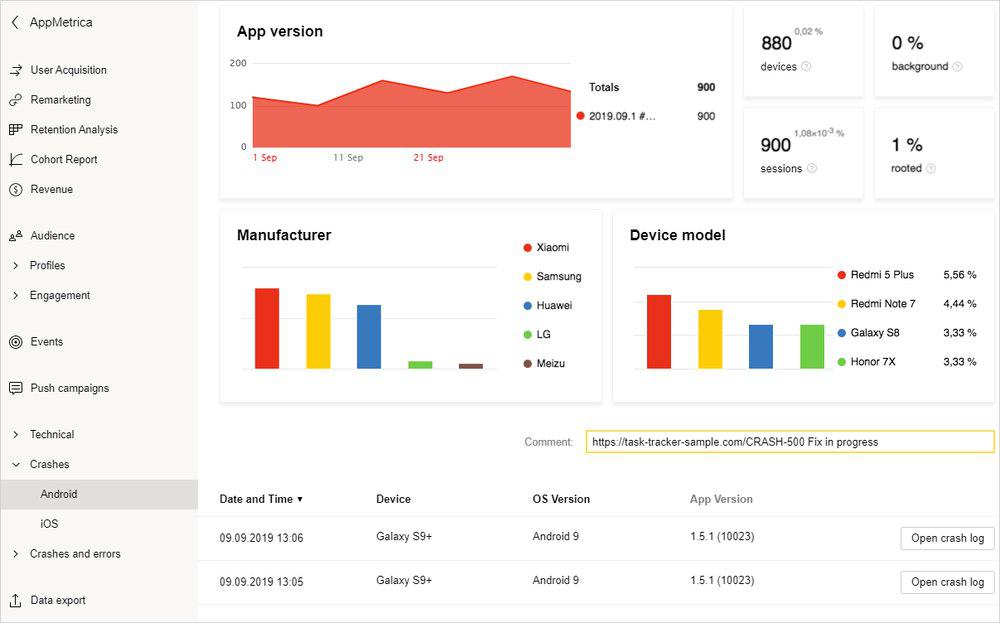
Granular statistics for each crash
From the report, users can study every problem in detail. The crash profile is a dashboard that highlights the most important data and allows to make use of new metrics, like Background that shows if an app crashed while running in background, and Rooted, which shows if crashes appeared on a device that’s been modified with jailbreak or other methods.
Internal view of a crash
The stack trace can be viewed from the crash profile. This is most useful for developers trying to fix the crash.
If the log doesn’t provide enough information, user profiles might be helpful. They show what actions users performed before the app crashed. This information is invaluable to QA engineers if the error cannot be reproduced.
All crash reports are already available for full use. In upcoming releases, the error report will be updated and a couple more features will appear.
*****
About AppMetrica
AppMetrica is an all-in-one free and unlimited install attribution, app analytics and marketing platform. It supports 3,300 app developers worldwide – from major banks and telecom operators to game creators, and covers 370+ million devices, processing 80 bln events daily. As of September 2019, it is ranked among Top-5 Attribution SDKs Global List by Appfigures (#4 on AppStore, #2 on Google Play).
AppMetrica is developed by Yandex – one of the largest internet companies in Europe based in Amsterdam and headquartered in Moscow, with 56.9% share on the Russian & CIS web search market in Q2 2019.
For more information about AppMetrica visit https://appmetrica.yandex.com/ and https://appmetrica.yandex.com/blog.
For media requests please contact Andrey Zhirinovskiy at Andrey.Zhirinovskiy@hkstrategies.com or +7 495 775 0077.
SOURCE: Yandex
Logo:
AppMetrica logo
- Digi Communications N.V. announces share transaction made by an Executive Director of the Company with class B shares
- BevZero South Africa Achieves FSSC 22000 Food Safety Certification
- Digi Communications N.V.: Digi Spain Enters Agreement to Sell FTTH Network to International Investors for Up to EUR 750 Million
- Patients as Partners® Europe Announces the Launch of 8th Annual Meeting with 2024 Keynotes and Topics
- driveMybox continues its international expansion: Hungary as a new strategic location
- Monesave introduces Socialised budgeting: Meet the app quietly revolutionising how users budget
- Digi Communications NV announces the release of the 2023 Preliminary Financial Results
- Digi Communications NV announces Investors Call for the presentation of the 2023 Preliminary Financial Results
- Lensa, един от най-ценените търговци на оптика в Румъния, пристига в България. Първият шоурум е открит в София
- Criando o futuro: desenvolvimento da AENO no mercado de consumo em Portugal
- Digi Communications N.V. Announces the release of the Financial Calendar for 2024
- Customer Data Platform Industry Attracts New Participants: CDP Institute Report
- eCarsTrade annonce Dirk Van Roost au poste de Directeur Administratif et Financier: une décision stratégique pour la croissance à venir
- BevZero Announces Strategic Partnership with TOMSA Desil to Distribute equipment for sustainability in the wine industry, as well as the development of Next-Gen Dealcoholization technology
- Digi Communications N.V. announces share transaction made by a Non-Executive Director of the Company with class B shares
- Digi Spain Telecom, the subsidiary of Digi Communications NV in Spain, has concluded a spectrum transfer agreement for the purchase of spectrum licenses
- Эксперт по торговле акциями Сергей Левин запускает онлайн-мастер-класс по торговле сырьевыми товарами и хеджированию
- Digi Communications N.V. announces the conclusion by Company’s Portuguese subsidiary of a framework agreement for spectrum usage rights
- North Texas Couple Completes Dream Purchase of Ouray’s Iconic Beaumont Hotel
- Предприниматель и филантроп Михаил Пелег подчеркнул важность саммита ООН по Целям устойчивого развития 2023 года в Нью-Йорке
- Digi Communications NV announces the release of the Q3 2023 Financial Results
- IQ Biozoom Innovates Non-Invasive Self-Testing, Empowering People to Self-Monitor with Laboratory Precision at Home
- BevZero Introduces Energy Saving Tank Insulation System to Europe under name “BevClad”
- Motorvision Group reduces localization costs using AI dubbing thanks to partnering with Dubformer
- Digi Communications NV Announces Investors Call for the Q3 2023 Financial Results
- Jifiti Granted Electronic Money Institution (EMI) License in Europe
- Предприниматель Михаил Пелег выступил в защиту образования и грамотности на мероприятии ЮНЕСКО, посвящённом Международному дню грамотности
- VRG Components Welcomes New Austrian Independent Agent
- Digi Communications N.V. announces that Digi Spain Telecom S.L.U., its subsidiary in Spain, and abrdn plc have completed the first investment within the transaction having as subject matter the financing of the roll out of a Fibre-to-the-Home (“FTTH”) network in Andalusia, Spain
- Продюсер Михаил Пелег, как сообщается, работает над новым сериалом с участием крупной голливудской актрисы
- Double digit growth in global hospitality industry for Q4 2023
- ITC Deploys Traffic Management Solution in Peachtree Corners, Launches into United States Market
- Cyviz onthult nieuwe TEMPEST dynamische controlekamer in Benelux, Nederland
- EU-Funded CommuniCity Launches its Second Open Call
- Astrologia pode dar pistas sobre a separação de Sophie Turner e Joe Jonas
- La astrología puede señalar las razones de la separación de Sophie Turner y Joe Jonas
- Empowering Europe against infectious diseases: innovative framework to tackle climate-driven health risks
- Montachem International Enters Compostable Materials Market with Seaweed Resins Company Loliware
- Digi Communications N.V. announces that its Belgian affiliated companies are moving ahead with their operations
- Digi Communications N.V. announces the exercise of conditional share options by an executive director of the Company, for the year 2022, as approved by the Company’s Ordinary General Shareholders’ Meeting from 18 May 2021
- Digi Communications N.V. announces the availability of the instruction regarding the payment of share dividend for the 2022 financial year
- Digi Communications N.V. announces the availability of the 2022 Annual Report
- Digi Communications N.V. announces the general shareholders’ meeting resolutions from 18 August 2023 approving amongst others, the 2022 Annual Accounts
- Русские эмигранты усиливают призывы «Я хочу, чтобы вы жили» через искусство
- BevZero Introduces State-of-the-Art Mobile Flash Pasteurization Unit to Enhance Non-Alcoholic Beverage Stability at South Africa Facility
- Russian Emigrés Amplify Pleas of “I Want You to Live” through Art
- Digi Communications NV announces the release of H1 2023 Financial Results
- Digi Communications NV Announces Investors Call for the H1 2023 Financial Results
- Digi Communications N.V. announces the convocation of the Company’s general shareholders meeting for 18 August 2023 for the approval of, among others, the 2022 Annual Report
- “Art Is Our Weapon”: Artists in Exile Deploy Their Talents in Support of Peace, Justice for Ukraine
- Digi Communications N.V. announces the availability of the 2022 Annual Financial Report
- “AmsEindShuttle” nuevo servicio de transporte que conecta el aeropuerto de Eindhoven y Ámsterdam
- Un nuovo servizio navetta “AmsEindShuttle” collega l’aeroporto di Eindhoven ad Amsterdam
- Digi Communications N.V. announces the conclusion of an amendment agreement to the Facility Agreement dated 26 July 2021, by the Company’s Spanish subsidiary
- Digi Communications N.V. announces an amendment of the Company’s 2023 financial calendar
- iGulu F1: Brewing Evolution Unleashed
- Почему интерактивная «Карта мира» собрала ключевые антивоенные сообщества россиян по всему миру и становится для них важнейшим инструментом
- Hajj Minister meets EU ambassadors to Saudi Arabia
- Online Organizing Platform “Map of Peace” Emerges as Key Tool for Diaspora Activists
- Digi Communications N.V. announces that conditional stock options were granted to executive directors of the Company based on the general shareholders’ meeting approval from 18 May 2021
- Digi Communications N.V. announces the release of the Q1 2023 financial results
- AMBROSIA – A MULTIPLEXED PLASMO-PHOTONIC BIOSENSING PLATFORM FOR RAPID AND INTELLIGENT SEPSIS DIAGNOSIS AT THE POINT-OF-CARE
- Digi Communications NV announces Investors Call for the Q1 2023 Financial Results presentation
- Digi Communications N.V. announces the amendment of the Company’s 2023 financial calendar
- Digi Communications N.V. announces the conclusion of two Facilities Agreements by the Company’s Romanian subsidiary
- Digi Communications N.V. announces the conclusion of a Senior Facility Agreement by the Company’s Romanian subsidiary
- Patients as Partners Europe Returns to London and Announces Agenda Highlights
- GRETE PROJECT RESULTS PRESENTED TO TEXTILE INDUSTRY STAKEHOLDERS AT INTERNATIONAL CELLULOSE FIBRES CONFERENCE
- Digi Communications N.V. announces Digi Spain Telecom S.L.U., its subsidiary in Spain, entered into an investment agreement with abrdn to finance the roll out of a Fibre-to-the-Home (FTTH) network in Andalusia, Spain
- XSpline SPA / University of Linz (Austria): the first patient has been enrolled in the international multicenter clinical study for the Cardiac Resynchronization Therapy DeliveRy guided by non-Invasive electrical and VEnous anatomy assessment (CRT-DRIVE)
- Franklin Junction Expands Host Kitchen® Network To Europe with Digital Food Hall Pioneer Casper
- Unihertz a dévoilé un nouveau smartphone distinctif, Luna, au MWC 2023 de Barcelone
- Unihertz Brachte ein Neues, Markantes Smartphone, Luna, auf dem MWC 2023 in Barcelona
- Digi Communications N.V. announces conditional stock options granted to a Director of the Company based on the general shareholders’ meeting approval from 28 December 2022
- Digi Communications N.V. announces the release of the 2022 Preliminary Financial Results
- CAMPAIGNS FOR HUMANITY: MARKETING AGENCY ANNOUNCES €10,000 AWARDS FOR RUSSIANS SUPPORTING UKRAINE
- One Year Since the Invasion: New Series Highlights Everyday People Transformed by War into Heroes
- Digi Communications N.V. announces Investors Call for the presentation of the 2022 Preliminary Financial Results
- BevZero Receives Top Environmental Certification
- Thompson Duke Industrial Attains CE Certification for its Cannabis Vaporizer Cartridge Filling Equipment
- Modern Media Hub Takes Huge Leap with Financing Help of Cap Expand Partners
- Digi Communications N.V. announces the release of the Financial Calendar for 2023
- Digi Communications N.V. announces the exercise of stock options by two of the Directors of the Company
- Tanduay Is First Asian Rum to Enter Austrian Market
- Digi Communications N.V. Announces the Resolutions of the General Shareholders’ Meeting from 28 December 2022, approving, amongst others, the 2021 Annual Accounts
- MIGUN LIFE's new personal healthcare products are unveiled, heralding the grand first debut at CES 2023
- Digi Communications N.V. announces that the Romanian version of the Annual Financial Report for the year ended December 31, 2021 for the Digi Communications N.V. Group is available
- Digi Communications N.V. Announces Convocation of the Company’s general shareholders meeting for 28 December 2022 for the approval of, among other items, the 2021 Annual Report
- Digi Communications N.V. Announces the availability of the Annual Financial Report for the year ended December 31, 2021 for Digi Communications N.V. Group
- Digi Communications N.V.’s Romanian subsidiary was designated winner of the auction organised for the allocation of certain radio frequency entitlements in 2600 MHz and 3400-3800 MHz bands
- Digi Communications NV announces the release of the Q3 2022 Financial Results
- Digi Communications N.V. announces a Subsequent Amendment of the Company’s 2022 financial calendar
- Digi Communications NV announces Investors Call for the Q3 2022 Financial Results presentation
- Sygnum Bank and Artemundi tokenize Warhol’s Marilyn Monroe artwork
- Your Daily Commutes Will be Seamless, Connected and Productive.
- The secondary market platform THELAPHANT.IO introduces, for the first time in Israel: "a stock liquidity plan" for high-tech employees and companies
- Teavaro and CDP Institute Offer Free Online Course on Identity Resolution
- Digi Communications N.V. announces a Subsequent Amendment of the Company’s 2022 financial calendar
- Digi Communications N.V. announces an Amendment of the Company’s 2022 financial calendar
- 12-month real-world achievements for Diabeloop’s Automated Insulin Delivery (AID):
- Digi Communications N.V. announces the availability of the Instruction regarding the Payment of Dividends for the Financial Year 2021
- Simplify Content za usluge organskog Content Marketinga otvara svoja vrata poduzećima da (zajedno) uspješno kreiraju kvalitetan i relevantan sadržaj za potencijalne i postojeće klijente
- Digi Communications N.V. announces the approval of interim dividend distribution and updates regarding the 2022 Financial Calendar
- A new, creativity-based educational method increases the ability to solve problems with young people, in the social field, or when building a team in the company
- Digi Communications NV announces the release of the H1 2022 Financial Results
- Mit Intelligenz geladen
- Digi Communications NV announces Investors Call for the H1 2022 Financial Results
- Digi Communications N.V. Announces the update of its 2022 Financial Calendar
- Digi Communications N.V. Announces the conclusion by the Company’s Spanish subsidiary of an amendment agreement to the facility agreement dated 26 July 2021
- Customer Data Platform Industry Grew Strongly in First Half of 2022: CDP Institute Report
- Metadeq Announces Breakthrough Non-Invasive Blood Test that Solves NASH Diagnosis Problem
- Η HBC Consulting Expert θεωρεί παράλογη την εμπλοκή του κυπριακού δικαστηρίου στην υπόθεση κληρονομιάς από τη χήρα του ολιγάρχη Μπόσοφ
- Esperto della società di consulenza HBC: le autorità italiane non hanno permesso a Katerina Bosov di vendere la villa del marito
- HBC Consulting Expert considers senseless the involvement of the Cypriot court in the case of inheritance by the widow of oligarch Bosov
- Fusion BPO Services is Opening New Center in Kosovo
- Hi-SIDE demonstrates an integrated high speed satellite data chain architecture at data rates exceeding 10 Gigabits per second
- Digi Communications N.V. announces that a joint venture of its subsidiary in Romania designated as one of the winners of the auction organized by the Belgian Institute for Postal Services and Telecommunications for the allocation of mobile spectrum frequency user rights
- KI-basierte Geldanlage für Privatpersonen – Velvet AutoInvest erhält 1,3 Mio. USD Seed-Investment
- Haizol Now Offer 3D Printing Services to Customers Worldwide
- Caravel Capital Fund Showcased At Secure Spectrum’s Hedge Fund Seminar
- Diabeloop, a key player in therapeutic AI applied to insulin delivery, announces 70 million euros new financing round to accelerate its international expansion
- Digi Communications NV Announces Availability of the 2021 Preliminary Annual Report (including the Company’s audited non-statutory Consolidated financial statements issued as per IFRS EU)
- Digi Communications N.V. Announces that conditional stock options were granted to executive directors of the Company and to directors and employees of the Company’s Romanian Subsidiary
- Caravel Capital Investments Inc. Founding Partner to Speak at Secure Spectrum Hedge Fund Seminar
- Digi Communications NV announces a correction of clerical errors by Amending the Q1 2022 Financial Report
- Digi Communications NV announces the release of Q1 2022 Financial Results
- Digi Communications N.V. announces Investors Call for the Q1 2022 Financial Results presentation
- Yield Crowd Tokenizes US $50M Real Estate Portfolio on Stellar Blockchain
- Digi Communications N.V. Announces an Amendment to the Financial Calendar for 2022
- Diabeloop presents new real-life results of DBLG1® System: Confirmed improvement in Time In Range +18.4 percentage points; Reduction of time spent in hypoglycemia to only 0.9%
- How two female entrepreneurs are redefining the lake travel industry
- Vil du være med å utvikle fremtidens bærekraftige reiseliv?
- Mettiti alla prova con la terza edizione del CASSINI Hackathon per rivitalizzare il settore turistico
- Προκαλέστε τον εαυτό σας στο 3ο CASSINI Hackathon και στοχεύστε την αναζωογόνηση του τουρισμού!
- Participez au 3e Hackathon CASSINI et relevez le défi de redynamiser le tourisme!
- 3. CASSINI Hackathon zur Neubelebung des Tourismus: Stellen Sie sich der Herausforderung!
- Írd újra Európa turizmusát a 3. CASSINI Hackathonon!
- Aceita o desafio do 3º CASSINI Hackathon para revitalizar o turismo!
- Podejmij wyzwanie! Weź udział w 3. Hackathonie CASSINI i pomóż ponownie ożywić turystykę!
- Daag jezelf uit op de 3e CASSINI Hackathon en blaas toerisme nieuw leven in
- Diabeloop adapts its self-learning, personalized insulin automatization software to be used with insulin pens
- Amadeus unveils five defining trends for the US group travel and events industry in 2022
- On World Bipolar Day ALCEDIAG announces EIT Health supported EDIT-B Consortium validating innovative blood diagnostic test for bipolar disorder
- Global & Europe Mental Health Software and Devices Market to Witness a Revenue of USD 13367.12 Million by 2030 by Growing with a CAGR of 13.28% During 2021-2030; Increasing Concern for Mental Health Disorders to Drive Market Growth
- Digi Communications NV announces the release of the 2021 Preliminary Financial Results
- Digi Communications NV announces Investors Call for the 2021 Preliminary Financial Results presentation
- At MWC in Barcelona, Amphenol will be exhibiting its wide offering for wireless service providers – including Open RAN compatible active 5G antennas
- ELIOS combined with cataract surgery delivers significant IOP reduction out to 8 years
- Tableau comparatif des pays : les caractéristiques à connaître avant de se développer à l’international
- Smart exosomes from an Australian technology leader
- Bucharest Digi Communications N.V. announces Share transaction made by an executive director of the Company with class B shares
- Transmetrics AI is Applied by DB Schenker to Improve Land Transport Network in Bulgaria
- Digi Communications N.V.: Announces repayment of an aggregate amount of approx. EUR 272 million of the Group’s financial debt
- El Liceo Europeo vence el Premio Zayed a la Sustentabilidad 2022 en Europa y Asia Central
- Framework rebrands to daappa, heralding a new phase in fintech solutions designed for private markets
- Digi Communications N.V. Announces the publishing of the Financial Calendar for 2022
- Manufacturing giant Haizol expands their offices in China
- Patients and R&D Leaders Jointly Present at EU Conference on Progress with Patient-Input to Transform Medicine Development
- Seminário Bíblico sobre “O Cumprimento da Palavra de Jesus no Mundo de Hoje”
- 'I Love fruit & veg from Europe': Weihnachten in der Schweiz ist gesund und voller Aromen
- Fidupar Now Live on Framework’s Core Solution
- Maya Miranda Ambarsari launches InterconnectDATA information platform for authentic data
- Digi Communications N.V. Announces that the offer of the Company’s Romanian subsidiary was designated winner of the auction organised for the allocation of certain radio frecquency entitlements
- New dating site aimed at people with mental health problems launches in Switzerland
- BITSCore Tests Satellite Cyber-Security and Ride-Share Algorithms on Australian Rocket
- StatusMatch.com ed Emirates collaborano per aiutare i frequenti viaggiatori italiani a tornare in volo
- StatusMatch.com and Emirates partner up to help Italian frequent flyers get back in the air
- MinDCet drivers and FTEX powertrain solutions enable EV GaN applications
- Digi Communications NV announces the release of the Q3 2021 Financial Results
- Origami and citoQualis Team up for Startups
- Digi Communications NV announces Investors Call for the Q3 Financial Results presentation
- Digi Communications N.V. announces the extraordinary general meeting’s resolution from 4 November 2021, approving the appointment of KPMG N.V. as the Company’s statutory auditor for the 2021 financial year
- Digi Communications N.V. announces The solution reached by the Bucharest Court of Appeal regarding the investigation conducted by the Romanian National Anticorruption Directorate with respect to RCS & RDS S.A., Integrasoft S.R.L. and certain of their directors
- Digi Communications N.V. Announces the results of the auction organised by the Portuguese Authority for Telecommunications
- Haizol expands its capabilities to include component assembly and product development
- EIC, the World’s Largest Multinational Innovation Program, to Invest €13.4M in Wi-Charge, a Game Changing Wireless Power Company
- European Weightlifting Federation on its way for Electoral Congress
- “Without women, We are unable to solve the world’s greatest challenges” — She Loves Tech 12 Hot Finalists ready to get their chance at the Local Pitch in South Europe!
- Significant improvement in increasing Time In Range and reducing hypoglycemia among people equipped with Diabeloop DBLG1
- Digi Communications N.V. Announces the Convocation of the Company’s Extraordinary General Meeting of Shareholders on 4 November 2021 in order to appoint KPMG N.V. as the Company’s new statutory auditor for the financial year 2021
- Unit of Measure enters partnership with Stibo Systems
- Haizol, metal manufacturing giant, launch a brand new website which is both user friendly and interactive
- Groundbreaking Immersive Experience from Samsung and Artist Michael Murphy Reveals a New Perspective for Visual Entertainment Through the Stunningly Slim Neo QLED TV
- Collaboration between Airbus and Neural Concept
- Archpriest Nikolay Balashov on Patriarch Bartholomew’s speeches in Kiev
- ABB's Peter Voser joins Xynteo's Europe Delivers partnership as it new Chairman
- Digi Communications NV announces that a new stock option programme was approved
- Leverage the benefits of digital manufacturing with Haizol
- Digi Communications NV announces the release of the H1 2021 Financial Results
- Digi Communications NV announces Investors Call on the Financial Results for H1 2021
- Rockegitarist-Sensasjon Rocky Kramer Har Fått Hovedrollen I Mutt Productions Filmen Rockin’ In Time
- Dispatch.d Offers Unique US Market Entry Services for European Impact Brands
- CSA Research’s New Localization Intelligence Analyzer, powered by LocHub, Helps Organizations Improve their Website’s Effectiveness for Global Customers
- Customer Data Platform Industry Accelerated During Pandemic: CDP Institute Report
- Digi Communications N.V. announces that two of its subsidiaries entered into two facility agreements
- Introducing Cap Expand Partners, Helping Business Leaders Break International Barriers
- Hong Kong’s Innovation and Technology Venture Fund Becomes Strategic Financial Investor of Ignatica
- Cure for prostate cancer on the horizon
- Fanpictor signs multi-year partnership with Royal Belgian Football Association
- Fanpictor unterzeichnet mehrjährige Partnerschaft mit dem Königlich Belgischen Fussballverband
- Fanpictor signe un partenariat pluriannuel avec la Royal Belgian Football Association
- Fanpictor firma una colaboración de varios años con la Real Federación Belga de Fútbol
- Fanpictor firma una partnership pluriennale con la Royal Belgian Football Association
- Fanpictor tekent meerjarige partnership met Koninklijke Belgische Voetbalbond
- Launch of the New Akenza Platform
- De zelflerende algoritme DBLG1®: eenvoudig te gebruiken voor een optimale en gepersonaliseerde behandeling van diabetes type 1
- Launch of the Anna Lindh Foundation Virtual Marathon for Dialogue!
- Digi Communications N.V. announces the exercise of stock options by the Executive Director of the Company pursuant to the decision of the Company’s general meeting of shareholders dated 30 April 2020 and in accordance with the stock option plan approved at the level of the Company in 2017
- New research unlocks long tail growth opportunity for the tech industry
- Digi Communications NV announces the availability of the instructions on the 2020 share dividend payment
- Digi Communications NV announces that conditional stock options were granted to several Directors of the Company based on the approval of the general meeting of shareholders from 18 May 2021
- Digi Communications N.V. Announces the Company’s General Shareholders Meeting resolutions adopted on 18 May 2021 approving, amongst others, the 2020 Annual Accounts
- Digi Communications N.V. (“Digi”) announces the Q1 2021 Financial results
- Digi Communications NV announces Investors Call for the Q1 2021 Financial Results
- Digi Communications N.V. announces an Amendment to the 2021 Financial Calendar
- Fastpayhotels Hits an Industry Milestone by Connecting 500 Hotels Per Day Through DerbySoft Technology
- 4 ways to build a more flexible supply chain
- Join the world's leading virtual CBD event for FREE
- DEEPENING STRATEGIC RELATIONSHIP BETWEEN UBC AND PIONEERING DECENTRALISED PLATFORM, MANYONE
- Mono Solutions recognizes Norwegian small business agency with best website 2021 award
- Mono Solutions and Xrysos Odigos unlock new opportunities for small businesses
- Behind the scenes of a 10,000-people online conference: creating a live-event atmosphere and leveraging cybersecurity software
- Largest Supply Chain for Face masks, FFP2, FFP3 and cloth masks
- TRANSMAR AND TRANSMETRICS SIGN DEAL FOR STATE-OF-THE-ART LOGISTICS COLLABORATION
- Amendment of Digi Communications N.V. Financial Calendar for 2021
- 4iG and Digi Communications NV’s Romanian subsidiary have entered into a term sheet with regards to a potential acquisition by 4iG of DIGI Group’s Hungarian operations
- “Building Healthy Relationships and Enhancing Gender Equality”: Young women from Cyprus, Egypt, Lebanon and Jordan come together
- Bring Ventures investit dans Crossborderit (CBIT), DDP et une solution de commerce électronique
- Bring Ventures investiert in Crossborderit (CBIT), eine DDP (geliefert verzollt) und E-Commerce Lösung
- Bring Ventures invests in Crossborderit (CBIT), DDP and ecommerce solution
- Lionspeed GP with Patrick Kolb and Lorenzo Rocco joins forces with CarCollection Motorsport in 2021
- Eurekos, ein klassenbester LMS-Anbieter, hat seine Position im renommierten Fosway 9-Grid™ für Lernsysteme verbessert
- Eurekos, en førsteklasses LMS-udbyder, har forstærket sin position på den prestigefyldte Fosway 9-Grid™ for læringssystemer
- Eurekos, ein erstklassiger LMS-Anbieter, hat seine Position auf dem renommierten Fosway 9-Grid™ für Lernsysteme weiter ausgebaut
- Digi Communications N.V. announces Share transaction made by an executive director of the Company with class B shares
- Digi Communications N.V.: Announces an Amendment to the Financial Calendar for 2021
- Ideanomics Invests $13M in Italian EV Motorcycle Company, Energica
- DigiSky and Asman Technology Announce Global Reseller Agreement
- Neowintech - O Marketplace Da Sua Próxima Solução Financeira
- Neowintech - Il Marketplace per la tua prossima soluzione finanziaria
- PIONEERING DECENTRALISED SECURE MESSAGING PLATFORM MANYONE ANNOUNCES STRATEGIC RELATIONSHIP WITH UNIVERSITY COLLEGE LONDON CENTRE BLOCKCHAIN TECHNOLOGY
- Digi Communications NV announces the release of the 2020 Preliminary Financial Results
- Fraunhofer IGD develops automated robotic arm to scan cultural objects in 3D, now cooperating with Phase One
- Adapt Fast or Disappear – Choosing the Right Supplier
- Digi Communications NV announces Investors Call for the 2020 Preliminary Financial Results
- A URSAPHARM Arzneimittel e a CEBINA anunciam uma parceria com vista a reaproveitar o anti-histamínico azelastina para combater a COVID-19
- URSAPHARM Arzneimittel et CEBINA annoncent un partenariat pour reconvertir l'antihistaminique azélastine afin de lutter contre la COVID-19
- URSAPHARM Arzneimittel y CEBINA anuncian una colaboración para readaptar el antihistamínico azelastine para combatir la COVID-19
- URSAPHARM Arzneimittel and CEBINA announce partnership to repurpose the antihistamine azelastine to combat COVID-19
- ANIL UZUN Will Launch Bass Guitar Lessons Series on Youtube
- Henrik Stampe Appointed CEO for Mono Solutions
- Anna Mossberg leder Nordens största privata AI-lab i Sverige: "Utan AI riskerar svenska företag att förlora sin konkurrensfördel."
- What COVID-19 has taught us about manufacturing & the importance of a digital online marketplace
- Digi Communications N.V. announces: the Supreme Court of Hungary dismissed the Company’s appeal related to the 5G Tender procedure
- Customer Data Platform Industry to Reach $1.5 Billion in 2021: CDP Institute Report
- Editor's pick archive....
GreenMantra Technologies Announces Exclusive Distribution Relationship with HARKE GROUP