
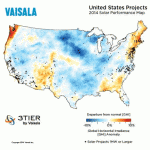
Solar Performance Maps show high variability throughout June, July, and August based on 15+ year records and illustrate associated impact on project profitability Las Vegas, Nevada, 23-10-2014 — /EuropaWire/ — Solar Performance Maps of the United States, released today by Vaisala, … Read the full press release