
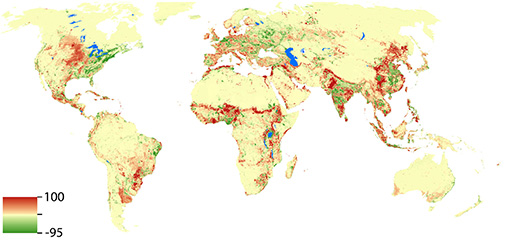
The map shows changes in human pressure from 1990 to 2010. Red areas are under increasing human pressure, while green areas are experiencing a decline in human pressure. Photo: Geldmann et al. 2014, Conservation Biology.
The map shows changes in human pressure from 1990 to 2010. Red areas are under increasing human pressure, while green areas are experiencing a decline in human pressure. Photo: Geldmann et al. 2014, Conservation Biology.